By Ron Melvin | Concord & Central Contra Costa Home-Selling Expert
Helping Concord, Walnut Creek, Pleasant Hill and Martinez homeowners sell strategically, especially when the move involves downsizing, an estate, probate, divorce or another major life transition.
Pillar Page: Concord Realtor
Quick answer: As of the end of September 2026, the Home Availability Index for the Concord area is 1.55. I track it across Central Contra Costa: Concord, Pleasant Hill, Walnut Creek and Martinez. So far this year, 3,534 homes were listed and 2,273 sold, so buyers had about 1.55 homes to choose from for every home that sold. That’s down slightly from 1.58 at this point in 2025. The overall East Bay is at 1.94, so our market remains tighter and more competitive than the East Bay as a whole.
Is now a good time to sell in Concord?
It’s the question I hear more than any other. And it’s a hard one to answer from the news.
One headline says prices are falling. Another says inventory is tight. The national numbers lump Concord in with Phoenix and Atlanta. Zillow gives you one number, and your neighbor heard another at the dog park.
If you’re thinking about selling, that noise is more than annoying. Pick the wrong moment or the wrong price and you can leave real money on the table. If you’re buying, you’re wondering whether to jump now or wait.
You deserve a clear read on Concord’s market, not the country’s.
Why I created the Home Availability Index
For years, I tracked the market the way most agents do, with months of inventory. Months of inventory is the number of active listings on the market divided by the number of homes sold in a month. If there are 300 active listings and 100 homes sold last month, that’s 3 months of inventory. It’s a useful number, but it bounces around month to month, and it doesn’t tell you much on its own. If someone says “we have 3 months of inventory,” my first question is: compared with what?
I also watch absorption rate, which is inventory flipped around. It’s the number of homes sold in a month divided by the number of homes available, shown as a percentage. If there are 100 homes on the market and 50 sell, the absorption rate is 50%: half the homes on the market were absorbed by buyers. A higher absorption rate means less inventory, and that often means prices are trending up.
The Home Availability Index works much the same way, and it measures the same thing: supply compared with sales. The difference is the time frame.
I wanted to compare a whole year against the same stretch of past years. So I created my own measurement, the Home Availability Index.
Here’s how it works. I take the number of homes listed so far this year in Central Contra Costa, which covers Concord, Pleasant Hill, Walnut Creek and Martinez, and divide it by the number sold over the same period. The result is the number of homes available for each buyer who actually bought one. I run the same numbers for the overall East Bay so we can see how our area compares.
A simple example:
- From January through September of one year, 1,000 homes are listed and 500 sell. 1,000 ÷ 500 = an index of 2.
- The year before, over the same months, 1,500 homes are listed and 500 sell. 1,500 ÷ 500 = an index of 3.
I then compare September to September, year after year. That way I’m comparing like with like, not a busy spring to a quiet December.
How to read the index: watch the trend, not the number
The number by itself changes all the time, and it looks different from one neighborhood to the next. The trend is what tells you where the market is heading.
| If the index is… | What’s happening | What it usually means for price |
|---|---|---|
| Rising | More homes listed, or fewer selling | Less demand, less competition; prices tend to soften |
| Falling | Fewer homes listed, or more selling | More demand, more competition; prices tend to firm up |
| Holding steady | Supply and sales moving together | A balanced market; pricing strategy decides who wins |
A higher index means buyers have more homes to choose from. With more choices, they compete less, and prices have a tendency to come down slightly. A lower index means buyers are chasing fewer homes, and that competition pushes prices up.
The October 2026 numbers: Central Contra Costa vs. the East Bay
Central Contra Costa = Concord, Pleasant Hill, Walnut Creek and Martinez combined. East Bay = Alameda and Contra Costa counties combined. All figures are year to date, January through September of each year.
Central Contra Costa: Concord, Pleasant Hill, Walnut Creek and Martinez
| Year | Median price | 30-year fixed rate | Homes sold | Homes listed | Home Availability Index | Cancelled, expired or withdrawn | Days on market |
|---|---|---|---|---|---|---|---|
| 2026 | $818,000 | 7.28% | 2,273 | 3,534 | 1.55 | 767 (22%) | 29 |
| 2025 | $797,000 | 6.34% | 2,282 | 3,600 | 1.58 | 792 (22%) | 28 |
| 2024 | $805,000 | 6.12% | 2,263 | 3,314 | 1.46 | 560 (17%) | 25 |
| 2023 | $780,000 | 7.31% | 2,236 | 2,906 | 1.30 | 373 (13%) | 21 |
| 2022 | $830,000 | 6.70% | 3,186 | 4,041 | 1.27 | 452 (11%) | 15 |
| 2021 | $790,000 | 3.01% | 3,932 | 4,610 | 1.17 | 455 (10%) | 15 |
| 2020 | $690,000 | 2.88% | 2,822 | 3,853 | 1.37 | 465 (12%) | 21 |
| 2019 | $645,000 | 3.65% | 3,156 | 4,066 | 1.29 | 460 (11%) | 25 |
East Bay: Alameda and Contra Costa counties
| Year | Median price | 30-year fixed rate | Homes sold | Homes listed | Home Availability Index | Cancelled, expired or withdrawn | Days on market |
|---|---|---|---|---|---|---|---|
| 2026 | $940,000 | 7.28% | 13,589 | 26,335 | 1.94 | 7,089 (27%) | 28 |
| 2025 | $950,000 | 6.34% | 13,871 | 27,049 | 1.95 | 7,489 (28%) | 28 |
| 2024 | $975,000 | 6.12% | 14,016 | 24,898 | 1.78 | 5,243 (21%) | 22 |
| 2023 | $915,000 | 7.81% | 13,528 | 22,813 | 1.69 | 3,750 (16%) | 22 |
| 2022 | $985,000 | 6.70% | 18,931 | 29,817 | 1.58 | 5,246 (18%) | 17 |
| 2021 | $935,000 | 3.01% | 23,827 | 34,715 | 1.46 | 4,157 (12%) | 14 |
| 2020 | $795,000 | 2.88% | 18,305 | 30,190 | 1.65 | 4,500 (15%) | 22 |
| 2019 | $735,000 | 3.65% | 20,471 | 32,717 | 1.60 | 5,763 (18%) | 26 |
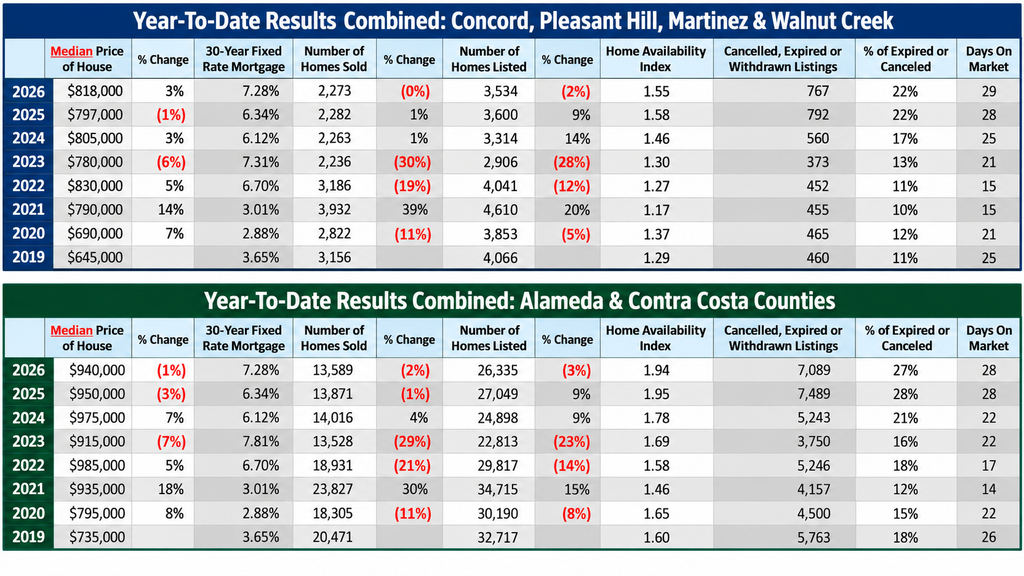
Year-to-date Home Availability Index, median price and days on market for Concord, Pleasant Hill, Martinez and Walnut Creek vs. Alameda and Contra Costa counties, 2019 to 2026, by Concord Realtor Ron Melvin
What 8 years of Concord numbers show
Look at 2021. The index hit its lowest point, 1.17. Buyers had barely more than one home to choose from for every home that sold, and competition was fierce. The next spring, in May 2022, the average Concord home hit its peak of almost $859,000.
Since then, the index has climbed, to 1.46 in 2024 and 1.58 in 2025, and prices have cooled to just over $800,000. That’s the pattern I see again and again: the higher the index, the lower prices tend to go. When buyers have more homes to choose from, they don’t have to compete as hard.
This year, the index has eased slightly, from 1.58 to 1.55, and the Central Contra Costa median price rose 3%, from $797,000 to $818,000. That’s the index working the way it should: a little less choice for buyers, a little more competition, a little higher price. And it happened even with the 30-year fixed rate averaging 7.28%, up from 6.34% last year.
2023 shows why the ratio matters more than raw counts. Central Contra Costa had its fewest sales of the period that year, 2,236 homes. On sales alone, that looks like a weak market. But listings fell even further, to 2,906, so the index stayed low at 1.30 and buyers still had few choices.
More than 1 in 5 listings didn’t sell this year
Here’s the number that worries me most for sellers. So far in 2026, 767 listings in Central Contra Costa were cancelled, expired or withdrawn. That’s 22% of everything listed, the same as 2025 and more than double the 10% we saw in 2021. Homes are also taking longer: 29 days on market this year, compared with 15 in 2021 and 2022.
Across the East Bay it’s worse: 27% of listings failed to sell.
Those homes didn’t fail because nobody was buying. More than 2,200 homes sold here this year. Most of them failed because the price, preparation or marketing didn’t create demand. In a market like this, the agent you hire and the price you start at decide whether you’re in the 78% that sell or the 22% that don’t.
How the Concord area compares with the East Bay
The overall East Bay index is 1.94 through September 2026, about the same as 1.95 last year. Central Contra Costa sits well below it at 1.55.
In plain terms, East Bay buyers have about 2 homes to choose from for every sale, while buyers in Concord, Pleasant Hill, Walnut Creek and Martinez have about 1.5. Our market has been tighter than the East Bay’s every single year since 2019, usually by 0.3 to 0.4 points. Homes here are in steadier demand, and that’s one more reason Concord homeowners have held their equity.
What I’m seeing on the ground this month: In October, prices in most of our cities are trending up. That surprised me, because mortgage rates have moved up this fall too. Rates have eased the last couple of weeks, I believe in anticipation of the Federal Reserve’s late-October meeting.
I don’t expect the price bump to last. I’ll measure the index again at the end of October, and I expect it to come in higher, with more homes available for each sale. If that happens, I expect prices to soften in November and the months that follow. If you’re thinking about selling, that’s worth knowing now, not in January.
For perspective, the long view is still strong. In January 2016, the average Concord home sold for just over $471,000. By May 2022, the monthly average was almost $859,000. Today it’s just over $800,000. Concord homeowners have built real equity, and knowing how to price against today’s market is how you protect it.
Market demand isn’t the same as demand for your home
Here’s the part most market reports leave out. Every home is different, so every home can create its own demand.
Picture 10 homes for sale in Concord and 10 buyers looking. On paper, that’s a balanced market. But if one home stands out and all 10 buyers want it, that home has 10 buyers competing while the other 9 sit with almost no interest. Same market, completely different results.
So the index tells us the conditions. My job is to figure out what will pull buyers toward your home and away from the others, so buyers compete for yours and drive the price up. That’s why homes in Concord can draw multiple offers even in a slower market, like 148 Roslyn Drive, which drew 9 offers and sold $81,000 over list in September 2026.
It also depends on the street. Prices in Ygnacio Woods don’t move like prices in North Concord, which is why micro-neighborhood pricing matters when you read any market number.
My 3-step plan to use this market to your advantage
- Get a read on your micro-market. Call me and I’ll show you where your neighborhood’s demand sits, using today’s active and pending listings, not just past sales. Start with a free Concord home value estimate.
- Price to create demand. When the index is rising, overpriced homes sit. I usually price slightly below market value to draw more buyers. Ten years of Concord data back it up in my Concord pricing strategy guide.
- Launch it to make buyers compete. Friday launch, two weekends of open houses, offers reviewed the following Tuesday. Here’s how a top Concord Realtor sells homes faster and the marketing checklist your agent should follow.
If you’re also buying your next home, the index helps you time both moves. See how to buy your next home before selling in Concord.
Questions to ask any Concord Realtor about the market
Any agent can quote a headline. Ask these to find out who really knows Concord:
- Is inventory in my neighborhood rising or falling compared with this time last year?
- How many homes are available for every home that sold near me?
- What are pending listings near me selling for right now, not just last spring’s sales?
- In this market, how would you price my home to create competition?
- What would make buyers choose my home over the others for sale?
For the bigger picture on choosing an agent, read how to find the best Concord Realtor, watch How to Find the Best Concord Realtor in 2026 | Full Guide, or catch the short version: 3 Questions to Ask Before Hiring a Concord Realtor.
What’s at stake if you misread the market
Price your home for last year’s market and it can sit while buyers pick the better-priced home down the street. The longer it sits, the more buyers wonder what’s wrong with it, and the more likely you are to cut the price and sell for less than if you’d priced it right from day one. Over the last 10 years in Concord, homes listed above market value sold for an average of $50,468 less than homes priced slightly low, and took 36 days to sell instead of 13.
What success looks like
You list knowing exactly what the market is doing in your corner of Concord. Your home is the one buyers want. The showing requests come the first weekend, and by Tuesday you’re comparing offers instead of waiting for one.
Want this month’s numbers for your neighborhood? Call me.
The citywide index is a starting point. I can run the same numbers for your neighborhood and tell you what they mean for your home. Call or text me at 925-708-1178. No pressure, just a straight answer.
Want to know more about who I am and how I work? Read my local’s guide to selling and buying a home in Concord, where I share my story, the neighborhoods I know best and the sales I’m proudest of.
- Selling? Find out what your Concord home is worth
- Buying? Search Concord homes for sale
- Questions? Call or text 925-708-1178
New Home Availability Index numbers are posted here every month.
Frequently Asked Questions About the Concord Real Estate Market
What is the Home Availability Index?
The Home Availability Index is a measurement Concord Realtor Ron Melvin created to track housing supply. It divides the number of homes listed so far this year by the number sold over the same period, for Central Contra Costa (Concord, Pleasant Hill, Walnut Creek and Martinez) and for the overall East Bay. The result shows how many homes were available for each buyer who bought one
What is the Home Availability Index for Concord right now?
As of the end of September 2026, the index for Central Contra Costa, which includes Concord, is 1.55, based on 3,534 homes listed and 2,273 sold this year. That’s down slightly from 1.58 at the same point in 2025. Since 2019, it has ranged from 1.17 in 2021 to 1.58 in 2025.
How does the Concord area compare with the overall East Bay?
The Concord area is tighter. Through September 2026, Central Contra Costa’s index is 1.55, while the overall East Bay’s is 1.94. Buyers here have fewer homes to choose from for every sale, and that gap has held every year since 2019
Is Concord a buyer’s or seller’s market in 2026?
At 1.55, Concord is fairly balanced, leaning slightly back toward sellers compared with 2025. Buyers have more choices than in 2021, when the index hit 1.17, but slightly fewer than last year. Well-priced homes still draw competition. Overpriced homes sit.
Does the Home Availability Index affect Concord home prices?
Yes. In Ron Melvin’s data, the higher the index, the lower prices tend to go. The index hit its low of 1.17 in 2021, and Concord’s average price peaked near $859,000 in May 2022. As the index rose to 1.58 in 2025, prices cooled to just over $800,000.
What does a rising Home Availability Index mean?
A rising index means more homes are being listed or fewer are selling. That signals less demand and less competition among buyers, so prices tend to soften
How is the Home Availability Index different from months of inventory?
They’re very similar. Months of inventory divides the active listings on the market by the number of homes sold in a month. The Home Availability Index divides all the homes listed so far this year by all the homes sold over the same period, then compares that with the same months in past years. That smooths out month-to-month swings and shows the longer trend.
What is absorption rate in real estate?
Absorption rate is the number of homes sold in a month divided by the number of homes available, shown as a percentage. If 100 homes are on the market and 50 sell, the absorption rate is 50%. It’s months of inventory turned around: a higher absorption rate means less inventory and often rising prices.
How many Concord-area listings fail to sell?
So far in 2026, 22% of listings in Central Contra Costa (Concord, Pleasant Hill, Walnut Creek and Martinez) were cancelled, expired or withdrawn, up from 10% in 2021. Across Alameda and Contra Costa counties, it’s 27%.
What is the median home price in the Concord area in 2026?
Through September 2026, the median price in Central Contra Costa is $818,000, up 3% from $797,000 in 2025. The median across Alameda and Contra Costa counties is $940,000.
Are Concord home prices going down?
Not yet. In October 2026, Ron Melvin is seeing prices trend up in most Central Contra Costa cities. But he expects the Home Availability Index to rise when he measures it at the end of October, and he expects that to lead to softer prices in November and the months that follow. The average Concord home sells for just over $800,000, down from a monthly peak of almost $859,000 in May 2022.
Can my home still get multiple offers in a slower market?
Yes. Every home creates its own demand. With the right price, preparation and launch, one home can draw several buyers even when the market overall is slower. 148 Roslyn Drive drew 9 offers in September 2026.
How often is the Concord Home Availability Index updated?
Ron Melvin updates the index on this page every month.
How can I get market numbers for my Concord neighborhood?
Call or text Ron Melvin at 925-708-1178, or request a free Concord home value estimate.
See what my clients say: Google Reviews · Zillow · Yelp · Facebook
About the author: Ron Melvin is a Concord Realtor (DRE #01927543) with the East Bay Real Estate Team at Keller Williams and the creator of the Home Availability Index. He has lived in Concord since 1992, owned a Concord home since 2001 and tracks 10 years of Concord list-price versus sale-price data. He began his real estate career in 1995 as a mortgage loan officer and is a U.S. Air Force veteran.
Ron Melvin, Concord Realtor | East Bay Real Estate Team at Keller Williams | DRE #01927543 | 925-708-1178 | #expertstrategiestosellyourhomeformore